In the ever-evolving landscape of web development, staying ahead requires cutting-edge tools. Enter ColdBox Debugger v4.2.0, the latest release that promises an action-packed experience with a plethora of features, improvements, and bug fixes. This update introduces the Hyper Collector, allowing you to track Hyper HTTP/S requests effortlessly with aggregated data on total time, slowest requests, grouping, and timelines. Lucee SQL Collector now enables profiling of SQL queries, providing valuable insights into your Lucee-powered applications. The addition of Heap Dump Support empowers users to generate Java heap dumps for offline analysis, ideal for debugging memory leaks and ensuring system stability. A revamped Request Dock and enhanced SQL/JSON formatting contribute to an improved user interface. Moreover, the ability to add timers manually and download heap dump snapshots adds versatility to your debugging toolkit.
ColdBox Debugger v4.2.0 is not just an upgrade; it's a leap forward in simplifying the debugging process and enhancing overall development efficiency. Explore the new features and take your debugging game to new heights!
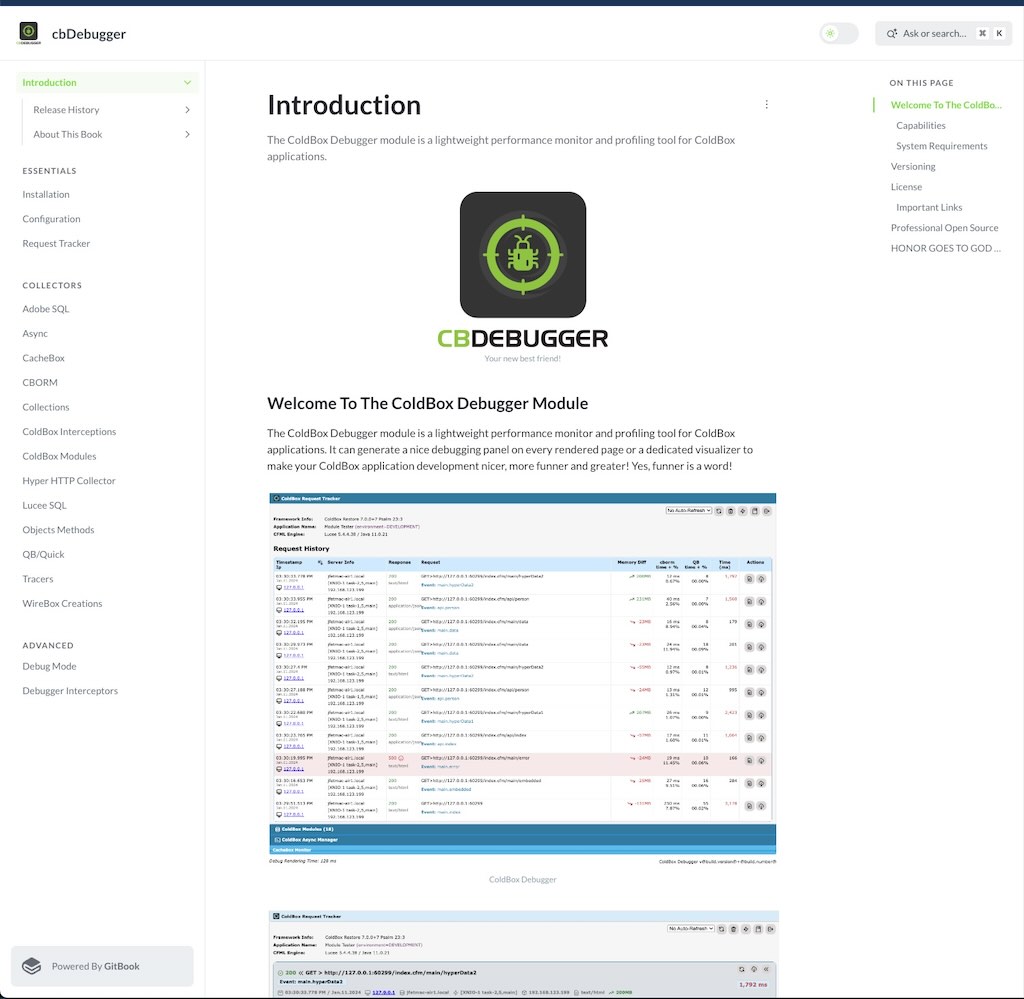
What is the ColdBox Debugger?
The ColdBox Debugger module is a lightweight performance monitor and profiling tool for ColdBox applications. It can generate a nice debugging dock on every rendered page or a dedicated visualizer to make your ColdBox application development nicer, funner and greater! Yes, funner is a word!

Debugger Request Visualizer
Capabilities
The ColdBox debugger is a lightweight performance monitor and profiler for your ColdBox applications. It tracks your requests, whether Ajax, traditional or REST, it's environment, execution and much more. Here is a listing of some of the capabilities you get with the ColdBox Debugger:
- Track all incoming requests to your applications
- Track exceptions and execution environment
- Track incoming HTTP requests, parameters, body, and much more
- Track final request collections
- Track Hibernate and cborm queries, criteria queries, and session stats
- Track qb and quick queries, entities, and stats
- Tap into LogBox via our Tracer messages and discover logging on a per-request basis
- Profile execution and results of ANY model object
- Profile execution of ANY ColdBox interception point
- Custom Timer helpers for adding timing methods and annotations anywhere in your code
- Profile your production or development apps with ease
- Track ColdBox modules and lifecycles
- Track Hyper HTTP/S calls
- Track Adobe ColdFusion Queries (ColdFusion 2018+)
- Track Lucee Queries
Installation
It's very easy. Just use CommandBox:
install cbdebugger --savedev
You will then need to configure the debugger with it's plethora of data collectors: https://cbdebugger.ortusbooks.com/essentials/configuration
Major Updates
Here is a listing of all the major areas of improvement of this release. However, you can see the full what's new guide here: https://cbdebugger.ortusbooks.com/introduction/release-history/whats-new-with-4.2.0
New Docs
We have a brand new book just for the ColdBox Debugger. Every single setting, feature, crook and cranny documented for your usage: https://cbdebugger.ortusbooks.com/
Hyper Collector
.png)
You can now track Hyper http/s requests right in a new panel. It will also aggregate the request's total time, slowest, grouped, and timeline. It also comes with some great options for configuration:
// Hyper Collector
hyper    : {
	enabled         : false,
	expanded        : false,
	logResponseData : false,
	logRequestBody  : false
}
Lucee SQL Collector
.png)
The ColdBox debugger can now profile any SQL running via Lucee queries. It will provide grouped, timeline, and slowest views as well. However, you must make sure that Lucee is in debugging mode.
IMPORTANT Please note that to use this feature the engine must have two debugging settings enabled
"debuggingDBEnabled":"true",
"debuggingEnabled":"true",
You can easily add those to your .cfconfig.json or enable it under the Debugging panel in the Lucee Admin.
.png)
Here are the configuration settings available for it:
luceeSql : {
	enabled : true,
	expanded : false,
	logParams : true
},
Heap Dump Support
.png)
Create a Java Heap Dump
You now can generate Java heap dumps from the debugger visualizer so you can analyze the heap offline. Great for debugging memory leaks or just system stability.
New Request Dock
The request dock has now been cleaned up to only show the request's information and the UI updated for a better and seamless dock UI. The rest of the information has been moved to the visualizer at the /cbdebugger entry point.
.png)
New Request Dock
Once you click on the dock, it will expand to show the current request's debugging information.
.png)
Expanded Dock
Improved SQL/JSON Formatting
We have added new improvements to visualizing SQL and JSON in the context panels.
 (1).png)
 (1).png)
.png)
Add Timers Manually
You can now add timers manually into the tracking facilities via the Timer object's add() method or via the TimerDelegate and the addCBTimer() method.
/**
 * Add a timer to the stack manually. You will need the label,
 * executionTime and stoppedAt timestamps
 *
 * @label         The label to use as a timer label
 * @executionTime The execution time in ms to register
 * @startedAt     The date time the timer was started
 * @stoppedAt     The date time the timer was stopped
 * @metadata      A struct of metadata to store in the execution timer
 * @parent        An optional parent label
 * @type          The type of execution timed: request, view-render, layout-render, event, renderer
 */
function add(
	required label,
	required executionTime,
	startedAt       = now(),
	stoppedat       = now(),
	struct metadata = {},
	parent          = "",
	type            = "timer"
)
You can get access to the Timer object in different ways:
// Get in your layouts/handlers/views/interceptors
getInstance( "Timer@cbDebugger" )
// Inject
property name="timer" inject="Timer@cbdebugger"
// ColdBox 7 Delegates
component delegates="TimerDelegate@cbdebugger"{}
Enjoy!
You can visit our documentation here: https://cbdebugger.ortusbooks.com/ to see all the capabilities you can get with the ColdBox Debugger.


Add Your Comment