Debugging a CommandBox BoxLang Server
So you’ve installed CommandBox and are running the latest BoxLang server like a boss. You open up your browser and are met with an error message. This looks like a job for, you guessed it, the BoxLang VS Code Debugger!
Hooking VS Code Up To Your Server
Connecting your debugger to an external my seem intimidating but CommandBox + VS Code makes this pretty straightforward.
Configuring CommandBox
To start we will need to make sure our server is configured properly. You can do this one of two ways.
We can add JVMArgs to the CLI
server start cfengine=boxlang javaVersion=openjdk21_jdk JVMArgs='-agentlib:jdwp=transport=dt_socket,server=y,suspend=n,address=8888'
The alternative approach is to add some configuration to our server.json.
{
  "JVM": {
    "args": "-agentlib:jdwp=transport=dt_socket,server=y,suspend=n,address=8888",
    "javaVersion": "openjdk21_jdk"
  }
}
In these examples I’ve used port 8888 as the port we want the debugger to connect to control the CommandBox server through. You can specify whatever open port you want. You just need to make sure that you use the same one at every step.
Once you start your server it should run as normal.
Configuring VS Code
Now that your server is configured, we need to setup VS Code. We will need to update your .vscode/launch.json. If you don’t see this file, you can create it yourself and VS Code will pick it up.
We want the launch.json to look something like
{
  "configurations": [
    {
      "name": "Debug CommandBox",
      "type": "boxlang",
      "request": "attach",
       // make sure this is the same value you configured your server with
      "serverPort": "8888"
    }
  ]
}
Starting a Debug Session
At this point your server is configured, it’s running, and you have just added a launch configuration. The next step is to run the debugger. All we need to do is open up the debug tab in our side-panel and select the correct configuration.
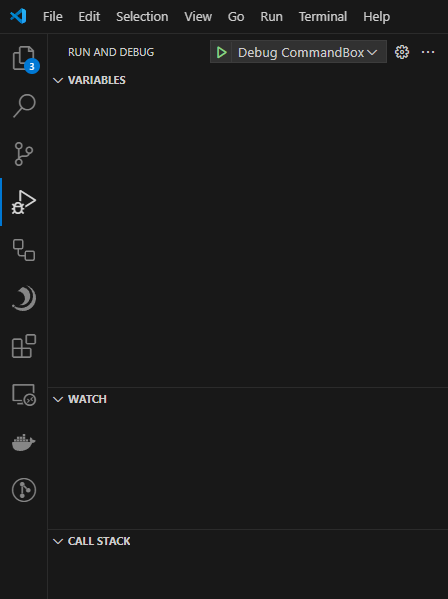
Now that we have everything setup all we need to do is press “play” or hit f5 and VS Code will fire up the BoxLang debugger and attach to your BoxLang server.
Conclusion
We’ve covered how easy it is to setup a BoxLang server and start debugging it with the BoxLang VS Code extension and CommandBox. Hopefully this will be a useful addition to your workflow.


Add Your Comment